


Introduction: The Silent Struggle Every Embedded Developer Faces
Every embedded systems enthusiast in India has faced this moment - the code is compiled, flashed, and seemingly working, but then suddenly crashes. Or worse, it works perfectly in the lab but fails spectacularly in the field. Welcome to the world of embedded debugging, where the difference between success and failure often comes down to your debugging strategy.
In our journey from the bustling electronics markets of Lamington Road in Mumbai to the DIY workshops in Bangalore's Koramangala, we've seen countless projects succeed or fail based on how effectively developers debug their embedded systems. Today, we'll demystify two of the most powerful debugging interfaces available to you: JTAG and SWD.
Whether you're developing a smart agriculture system for rural India, building an IoT device for smart cities, or creating an educational robotics platform, understanding these interfaces is crucial. They're not just debugging tools - they're your window into the heart of your embedded system.
Prerequisites: Your Debugging Toolkit
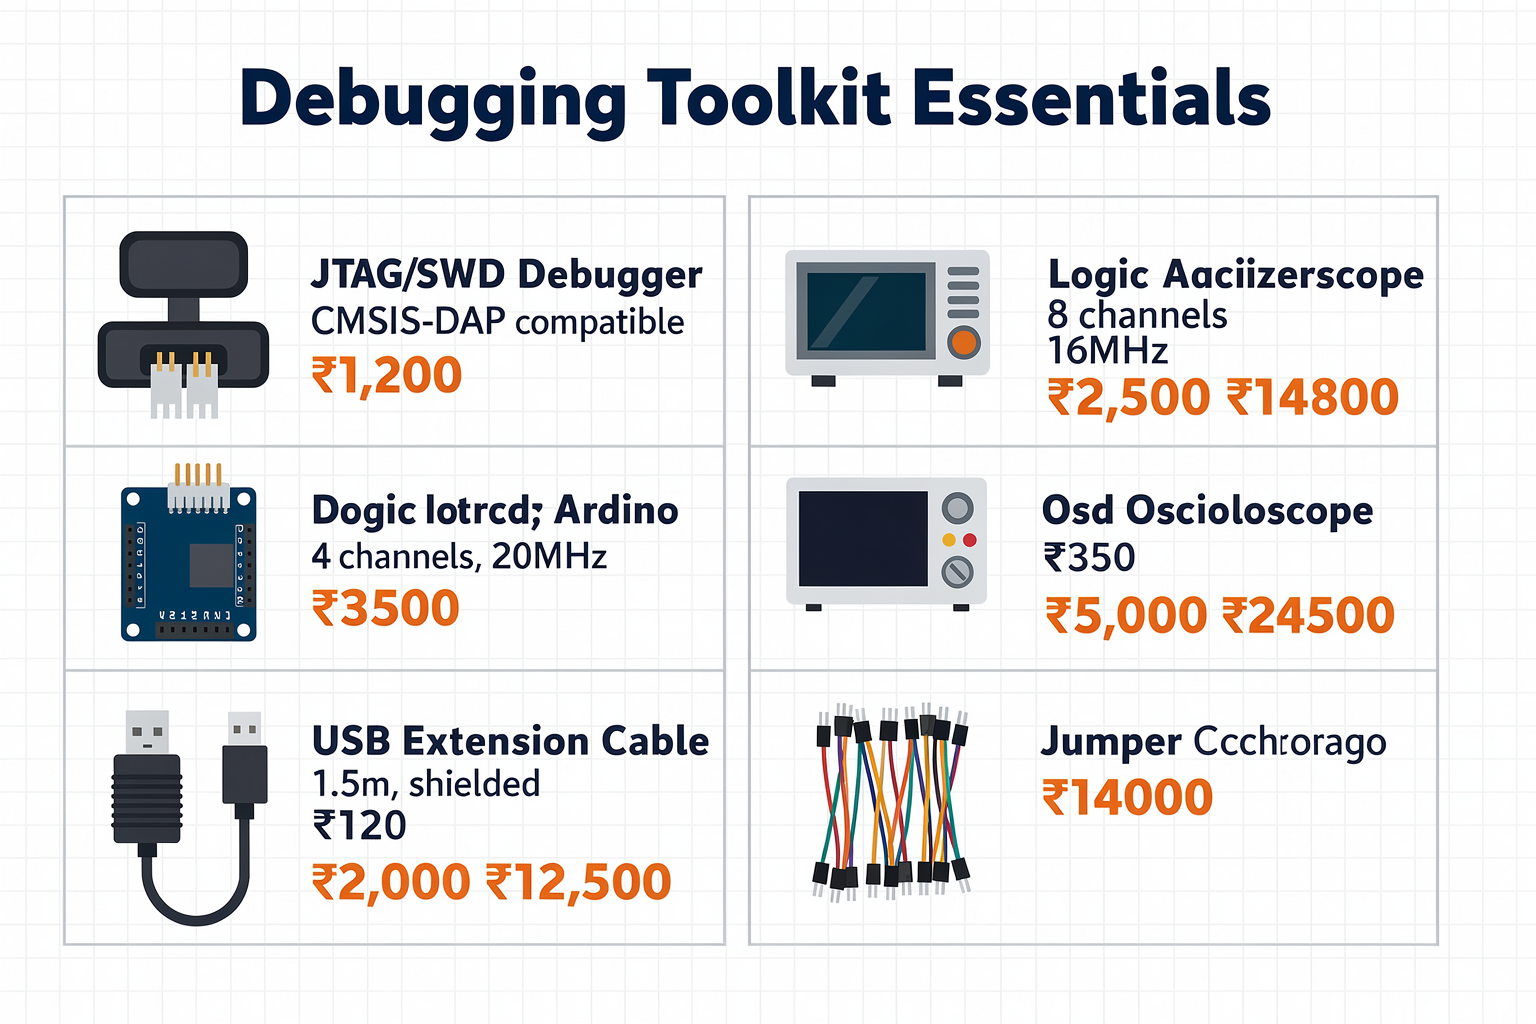
Before diving into JTAG and SWD, let's ensure you have the right equipment. Here's what you'll need, all available right here at TecnoMate across India:
| Component | Specification | Price (₹) | Availability |
|---|---|---|---|
| JTAG/SWD Debugger | CMSIS-DAP compatible | 1,200 | In Stock |
| Logic Analyzer | 8 channels, 16MHz | 2,500 | In Stock |
| Oscilloscope | 4 channels, 20MHz | 5,000 | In Stock |
| Target Board | Arduino compatible | 350 | In Stock |
| USB Extension Cable | 1.5m, shielded | 120 | In Stock |
| Jumper Wires | 40-pin set | 80 | In Stock |
| Power Supply | 5V, 2A | 250 | In Stock |
Pro Tip: If you're just starting, begin with a CMSIS-DAP compatible debugger. They're versatile, cost-effective, and work with most development boards available in the Indian market.
Getting Started: Understanding the Fundamentals
What is JTAG?
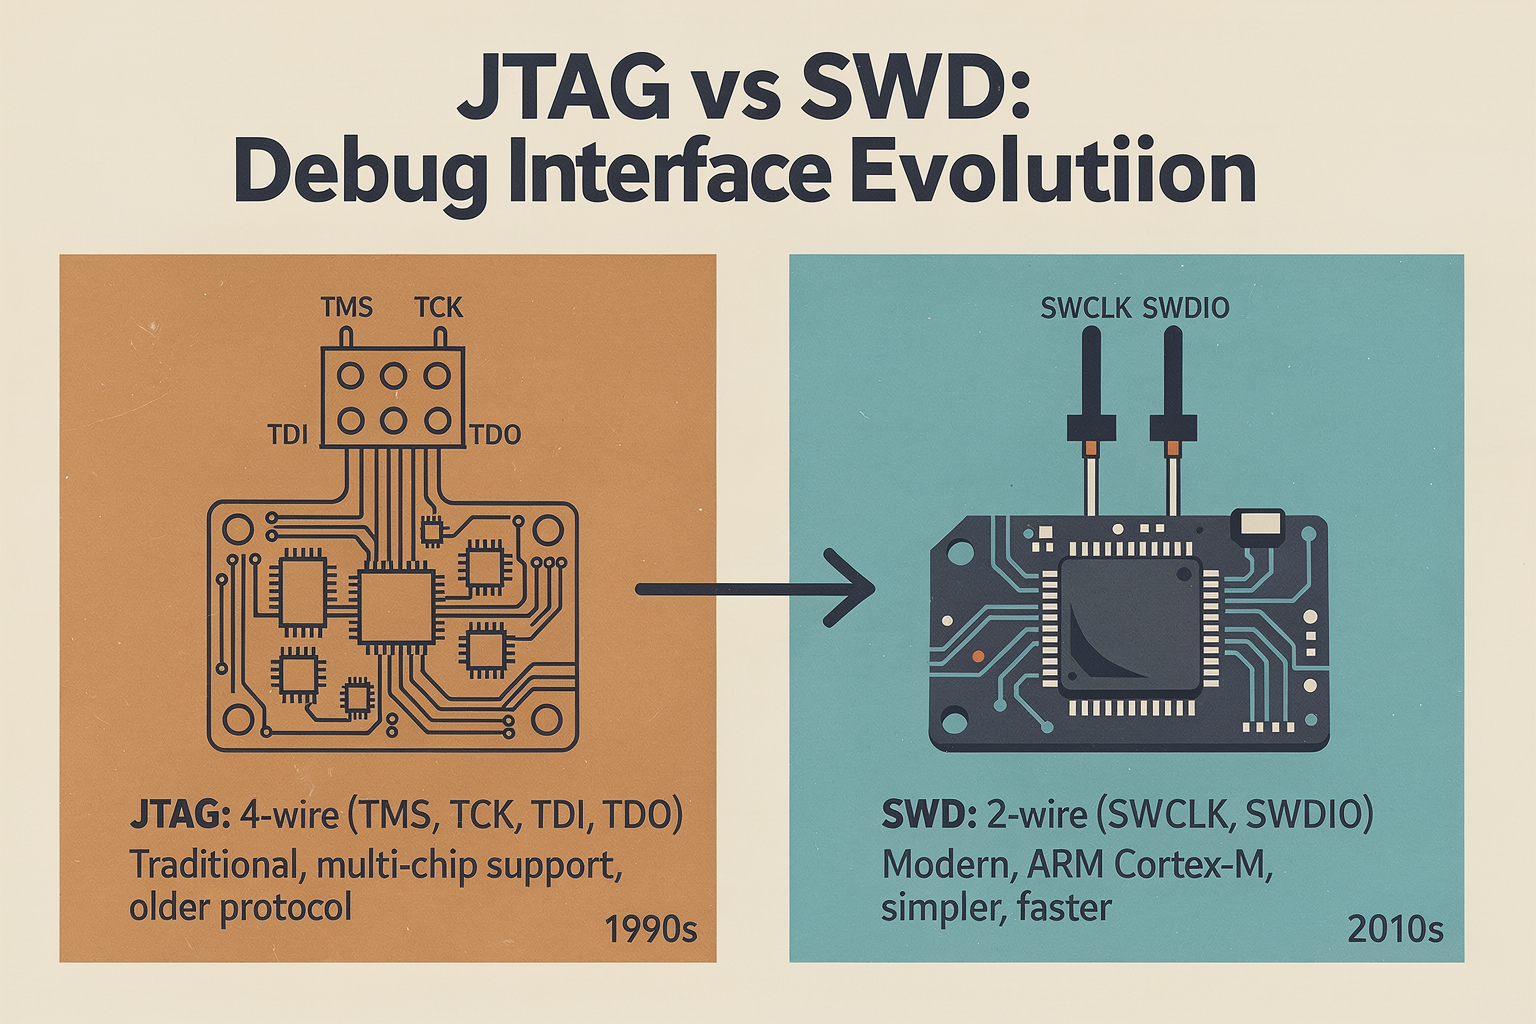
JTAG (Joint Test Action Group) is the older, more established debugging protocol. Originally designed for testing printed circuit boards, it evolved into a powerful debugging interface. Think of JTAG as the Swiss Army knife of embedded debugging - it can do almost anything, but sometimes you need to know which tool to use.
JTAG uses a standard 4-wire interface (TMS, TCK, TDI, TDO) plus additional pins for optional features like TRST (reset). The beauty of JTAG lies in its ability to debug multiple microcontrollers on a single board simultaneously - a feature that's invaluable when you're working with complex embedded systems.
What is SWD?
SWD (Serial Wire Debug) is the modern successor to JTAG, introduced with ARM Cortex-M microcontrollers. It simplifies the interface by reducing it to just two wires (SWCLK and SWDIO) plus GND. This reduction in pins means more space for your actual project and simpler board designs.
SWD uses a much simpler protocol, making it faster and more power-efficient. For most modern embedded projects using ARM Cortex-M processors (which dominate the Indian DIY market), SWD is often the preferred choice.
Code Example: Setting Up a Simple Debug Session
Here's a practical example of how you might program a microcontroller using SWD. This example uses an ESP32, which is extremely popular among Indian engineering students for its WiFi capabilities and affordability.
#include "driver/gpio.h"
#include "freertos/FreeRTOS.h"
#include "freertos/task.h"

#define LED_PIN GPIO_NUM_2

void blink_task(void *parameter) {
    while (1) {
        gpio_set_level(LED_PIN, 1);
        vTaskDelay(pdMS_TO_TICKS(500));
        gpio_set_level(LED_PIN, 0);
        vTaskDelay(pdMS_TO_TICKS(500));
    }
}

void app_main() {
    gpio_config_t io_conf;
    io_conf.intr_type = GPIO_INTR_DISABLE;
    io_conf.pin_bit_mask = (1ULL << LED_PIN);
    io_conf.mode = GPIO_MODE_OUTPUT;
    io_conf.pull_down_en = GPIO_PULLDOWN_DISABLE;
    io_conf.pull_up_en = GPIO_PULLUP_DISABLE;
    gpio_config(&io_conf);

    xTaskCreate(blink_task, "blink_task", 2048, NULL, 5, NULL);
}
Debugging Tip: When using SWD, you can set breakpoints directly in your code. In the ESP32 Arduino IDE, you can use the Serial Monitor to see debug messages while your program is paused at a breakpoint.
Advanced Debugging Techniques
Using Your Debugger Effectively
Let's look at some advanced techniques that will save you hours of debugging time:
1. Hardware Breakpoints vs Software Breakpoints
Hardware breakpoints are superior because they don't modify your code. They use the microcontroller's debug resources to monitor memory addresses. SWD supports up to 4 hardware breakpoints on most Cortex-M processors.
# Example of setting a hardware breakpoint in Python using pyocd
from pyocd.debug.elf.elf import ELFBinaryFile
from pyocd.debug.elf.elf_file import ELFBinaryFile
from pyocd.core.helpers import ConnectHelper

# Connect to the target
session = ConnectHelper.session_with_chosen_probe()

# Load the ELF file
elf = ELFBinaryFile('your_project.elf')
elf.parse()

# Get the debug core
core = session.board.target.cpu
core.enable_debug()

# Set hardware breakpoint at function entry
bp = core.set_breakpoint(elf.get_function_address('main'))
2. Watchpoints for Memory Monitoring
Watchpoints are invaluable for catching memory corruption issues. You can set them to trigger when a specific memory address is read or written.
Common Debugging Scenarios
| Scenario | Recommended Approach | Tools Needed |
|---|---|---|
| Intermittent crashes | Use trace buffer and timestamps | JTAG + Logic Analyzer |
| Memory corruption | Set watchpoints on suspected variables | SWD with at least 2 breakpoints |
| Performance issues | Use DWT cycle counter or ITM | JTAG with Data Watchpoint |
| Communication protocols | Use logic analyzer for timing | Logic Analyzer + SWD |
Common Mistakes and How to Avoid Them
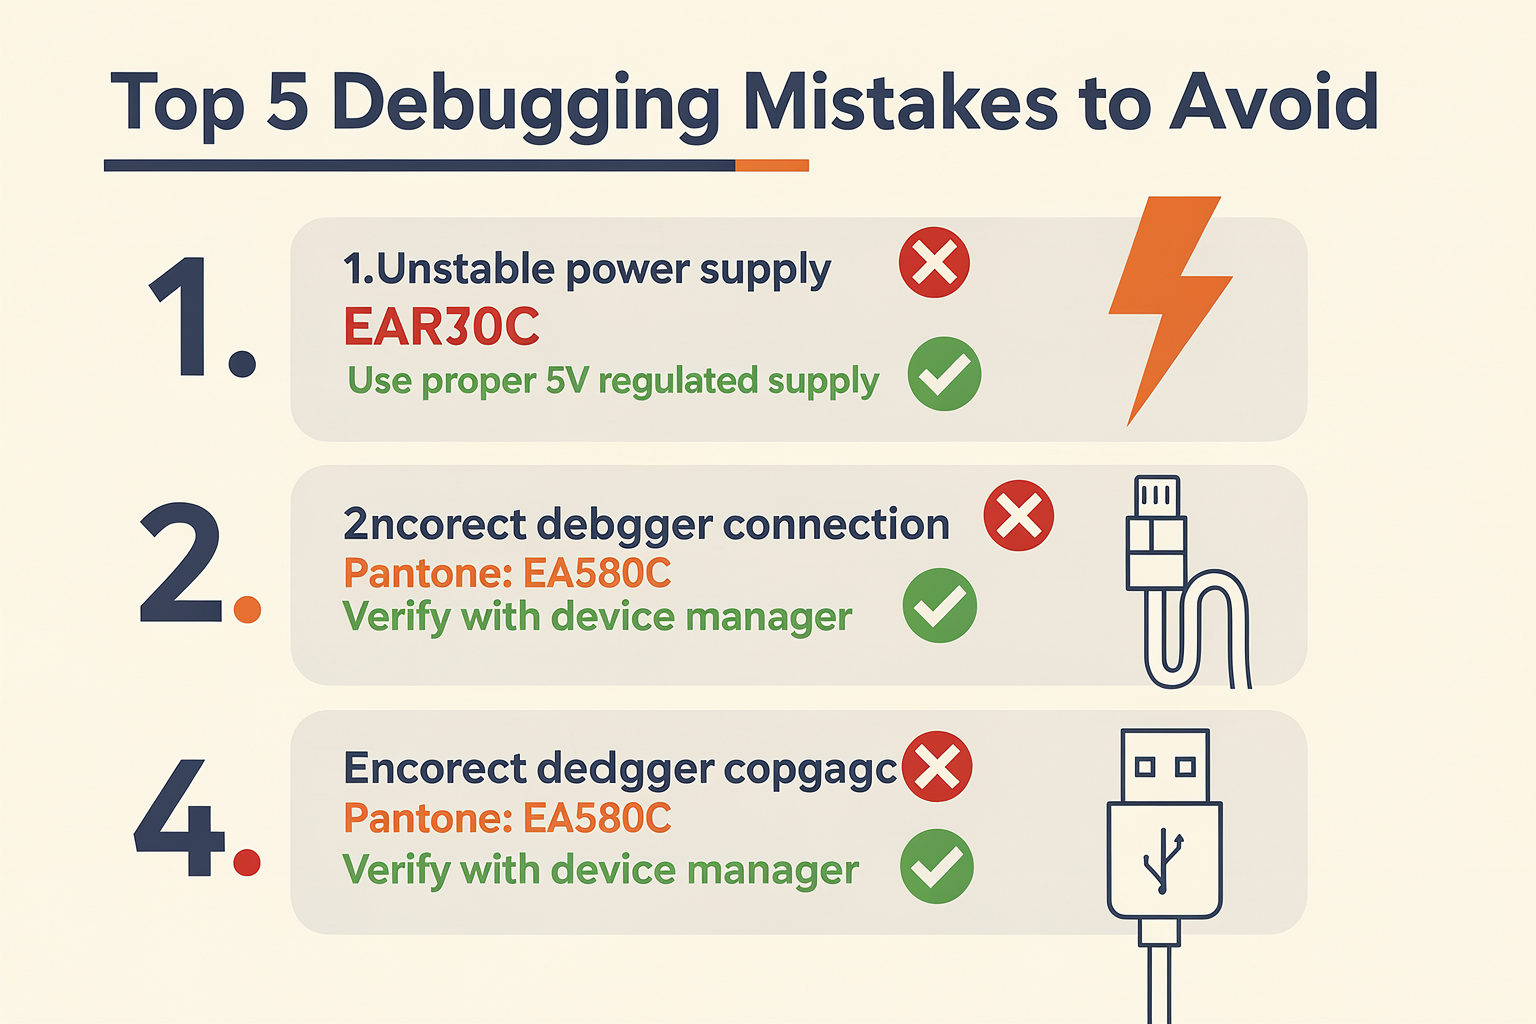
Even experienced developers make debugging mistakes. Here are the most common ones we've observed among Indian engineering students:
| Mistake | Consequence | Solution |
|---|---|---|
| Not checking debugger connection | Wasted time thinking code is wrong | Always verify connection with device manager |
| Using wrong clock speed | Timing-related bugs | Match probe clock to target frequency |
| Ignoring power issues | Random crashes | Use proper power supply with filtering |
| Not checking pin assignments | Debugger not communicating | Verify SWD/JTAG pin mapping for your board |
| Overlooking bootloader conflicts | Debugger can't connect | Disable bootloader or use DTR pin |
Practical Tip from the Field: Many development boards available in India (like those from our Chandni Chowk suppliers) have SWD pins that aren't clearly labeled. Always double-check with a multimeter before connecting your debugger.
Troubleshooting Section: When Debugging Goes Wrong

Even with the best tools and techniques, sometimes things don't work. Here's a systematic approach to troubleshooting:
Step 1: Check Physical Connections
- Verify power supply stability (5V ±5% for most microcontrollers)
- Check SWD/JTAG signal integrity with an oscilloscope if possible
- Ensure all ground connections are solid
Step 2: Verify Software Configuration
- Confirm your debugger firmware is up to date
- Check that your IDE
Ready to start building?
Explore our collection of DIY kits and components. All project components mentioned in this blog are available in our store.
Browse All Projects